#Rockfall Simulation
Once the profile and terrain have been defined, the rockfall simulation can be started.
.png)
|
Results |
|
|
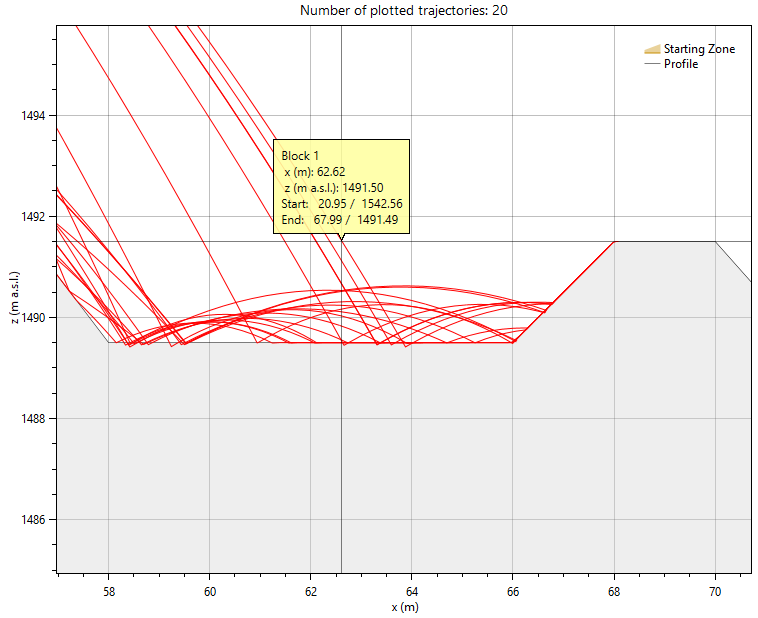
All block trajectories selected under Block Selections are plotted here. The mouse control is explained here: Mouse Control of Plots |
|
|
|
Mouse click on a block trajectory shows details of the block: block ID, cursor position, start point of the block, deposition point of the block.
|
.png)
|
One of the six results can be displayed in the selection box. The following options are available: •Bounce Height above Profile •Total Energy •Block Passages •Block Speed •Translation Energy •Rotation Energy
|
|
|
|
|
.png)


|
Tabs Simulation / Plotting / Block Selections / Impact Details |
|
|
|
|
|
|
|
.png)
.png)
|
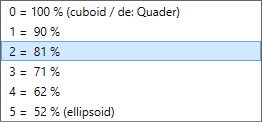
The block is characterized by: •Axis A: largest axis •Axis B •Axis C: shortest axis, serves as rotation axis •Density •Roundness ratio: With constant axes, the greater the degree of rounding, the smaller the volume. Since the moment of inertia is also directly mass-dependent, the moment of inertia also decreases when the degree of rounding is increased.
The calculated block attributes are also shown here: •Moment of inertia: takes into account the degree of rounding •radius of the replacement sphere: takes into account the degree of rounding •Block volume: takes into account the degree of rounding •Cuboid volume: Cube with edge lengths A, B and C. Corresponds to rounding degree 0. •Block weight: takes the degree of rounding into account.
|
|
|
|
|
.png)
|
•Number of simulations: determines the number of blocks that are started within the start zone. The maximum number of simulations is 500. •Cell size: determines the resolution of the statistics. A small value (<5m) can make it difficult to read long profiles and slow down the display. •Starting zone: Definition of the starting zone. The blocks are distributed evenly in this area. •Consider block axes: The simulation is calculated on a second, virtual profile that is raised by half of the mean value of the axes A and B [=(A+B)/4]. |
|
|
|
|
.png)
|
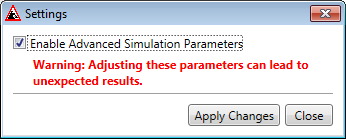
•Random part of hit distance (k): A separate hit distance is calculated for each block when it enters the forest. The hit distance is a normally distributed random number with the following characteristics: (mean value, standard deviation) = (hit distance, k* hit distance). The scaling of the scatter (k) has been set to k=0.1 (=10%), but can be changed. If k=0 is set, the first tree hit always occurs after the same hit distance, without a random portion. •The other parameters are not editable (except for the block density). See Options for the activation of these parameters. •Factor Jumping-Rolling •Rolling Friction •Velocity to abort after Impact •Velocity to abort Rolling Process |
|
|
|
|
.png)
.png)
|
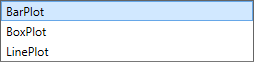
•Statistics Plot type: Here you can choose between displaying the statistics as bar plot, as box plot or as line plot. •Boxplot Whiskers: Switch between the two Whiskers definitions of a boxplot. •Plot dam definition: Show dam geometry (if available) •Plot forest zones: Display of forest zones including the maximum tree height •Plot starting zone: Show starting zone •Plot variable quantile: Additional representation of the variable quantile in the statistics plot •Variable Quantile: Definition of the quantile |
|
|
|
|
.png)
|
Experimental Plot Options |
|
|
•Plot cells: Representation of statistical cells in the profile plot •Plot impact zone: Show impact zone for export of impact details (special results) •Plot parallel profile: display the profile shifted upwards by half the average of axes A and B [=(A+B)/4]. •Plot terrain zones: Graphical representation of the various terrain zones •Plot tree hits: Each individual tree hit (if available) is displayed graphically. |
|
|
|
|
.png)
Remark: The selected blocks have an influence on the representation in Rockfall Simulation, Layout and Graphic, and Animation.
.png)
.png)
|
Selection Functions |
|
|
•Select All •Select Modulo: select all blocks that fulfill the condition ID % Divisor = Remainder. Example: With divisor 2 every second block is selected, starting with ID 0. •Select Count: certain number of blocks, starting with Start ID •Select None •Invert Selection |
|
|
|
|
.png)
Condition for the calculation of impact details: The option Consider block axes must be activated for the simulation. Otherwise no impacts can be calculated.
Depending on a dam definition in the profile, different hit results result:
•If a Dam Definition dam definition is saved, only hits on the dam flank are calculated and listed.
•If no Dam Definition is saved, all hits on the profile are calculated and listed.
.png)
|
Graphic |
|
|
Impacts selected in the impact list can be visualized individually. The block with axis length = half of the mean value of the axes A and B [=(A+B)/4] is drawn as a circle with center and contact point on the profile / dam. |
|
|
|
|
.png)
|
Options |
|
|
•Show filtered blocks: The Block Selection is adapted to the impact list. •Show selected block: Only the impact / block selected in the impact list is plotted in the graphic. •Reset Filter: All impact details are listed in the impact list. •Fit to dam: If a dam is present in the profile, the filter area on the x-axis can be adjusted to the dam flank. •Export Impact Details: All impacts listed in the hit list can be exported as TXT files. |
|
|
|
|
|
Filter (x Axis, Energy) |
|
|
Here you can define filters for the impact list: •Restrict range on the x-axis •Define Minimum Impact Energy |
|
|
|
|
|
Impacts List |
|
|
List of all filtered impacts.
Columns: •Block number •x / z: Impact coordinate = impact point on the profile / dam •Trajectory inclination: Angle to the horizontal. Positive values = ascending, negative values = descending. •Impact angle: Angle to profile. •Impact energy •Dam impact height: Vertical distance to the dam foot. Only useful if dam definition exists. Otherwise value = -99
In the lower right corner the number of filtered impacts is shown compared to the total available number of impacts. |
|
|
|
|
.png)
Copyright © 2017-2023 GEOTEST AG