#Dam Statistics
In the dam statistics, you can evaluate the block trajectories and dam impact hits calculated in the rockfall simulation with regard to the effectiveness of a defined dam. This allows the position, shape and dimension of the dam to be assessed.
.png)
|
•Compute Statistics and Impacts: Start of calculation •Copy Impact to Playground: The selected dam impacts below can be copied to the Playground for more precise parameterization. •Export Satistics: Generate a PDF with a statistics summary |
|
|
|
|
|
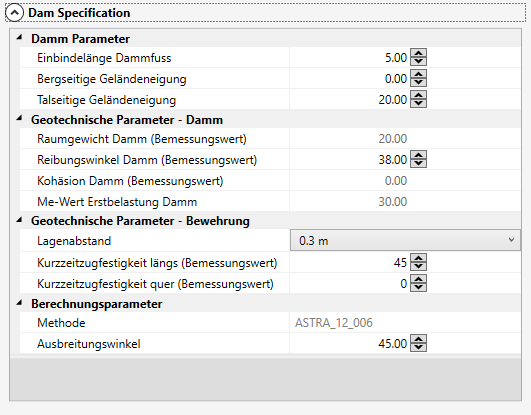
In this table, the dam parameters can be set for statistical analysis. The dam geometry cannot be changed here because it is already defined in the profile. |
|
|
|
|
|
Dam Statistics |
|
|
The left column summarizes how many blocks do not reach the dam, reach the dam flank ("surge up" without hits), hit the dam flank (with impact) and pass the dam. The dam impacts are further analyzed (see table below for individual evaluation) and categorized according to the safety against failure (sufficient, tolerable, insufficient, not calculated).
In the right column, the effectiveness of the dam is shown in the pie chart. Blocks that damage the dam too severely ("insufficient") or overcome it are displayed as "NOT OK". The remaining blocks are considered to be held back and are designated as "OK". If none of the blocks reaches the dam, the dam is called "not needed".
With the buttons below the corresponding blocks of the respective category can be selected. These are then displayed in the result and in the layout.
|
|
|
|
|
.png)
|
A dam simulation is carried out for all dam impacts from the rockfall simulation. In the table the block number, total impact energy (kJ), total penetration depth (m) of the block, the numerical safety against failure and the impact height (m) vertically above the dam base point are compiled. Each of these columns can be sorted.
You can select a dam impact by clicking on a specific line with the mouse. This is then displayed in the right window.
|
|
|
|
|
.png)
|
The selected block or dam impact in the table is displayed graphically and numerically here. The output parameters cannot be adjusted in this window. If you wish, you can: •adjust the dam specification and recalculate the statistics, or •copy the selected dam impact into the Playground and edit it there.
|
|
|
|
|
.png)
Copyright © 2017-2023 GEOTEST AG